文章目录
  1. 重抽样与自助法
    1. 1、置换检验
    2. 2、使用coin包进行置换检验
    3. 3、ImPerm包置换检验
    4. 4、自助法

重抽样与自助法

1、置换检验

1
2
3
4
5
6
7
8
> #置换方法并不是将统计量与理论分布进行比较,而是将其与置换观测数据后获得的经验分布进行比较,
> #根据统计量值的极端性判断是否有足够理由拒绝零假设。比如判断两组处理数据的内在差异性
> #将所有观测组数据混合后重新随机拆分至所有组合计算统计量如(t值),所有统计量升序排列,根据第一个统计量
> #(如t0)进行判断
> #置换检验真正发挥功用的地方是处理非正态数据(如分布偏倚很大)、存在离群点、
> #样本很小或无法做参数检验等情况。不过,如果初始样本对感兴趣的总体情况代表性很差,即使
> #是置换检验也无法提高推断效果。
> #置换检验主要用于生成检验零假设的p值,它有助于回答“效应是否存在”这样的问题。

2、使用coin包进行置换检验

1
2
3
4
5
6
7
8
9
10
11
12
13
14
15
16
17
18
19
20
21
22
23
24
25
26
27
28
29
30
31
32
33
34
35
36
37
38
39
40
41
42
43
44
45
46
47
48
49
50
51
52
53
54
55
56
57
58
59
60
61
62
63
64
65
66
67
68
69
70
71
72
73
74
75
76
77
78
79
80
81
82
83
84
85
86
87
88
89
90
91
92
93
94
#独立2样本检验和K样本检验
> library(coin)
> score <- c(40,57,45,55,58,57,64,55,62,65)
> treatment <- factor(c(rep("A",5), rep("B",5)))
> mydata <- data.frame(treatment, score)
> t.test(score~treatment, data=mydata, var.equal = TRUE)
Two Sample t-test
data: score by treatment
t = -2.345, df = 8, p-value = 0.04705
alternative hypothesis: true difference in means is not equal to 0
95 percent confidence interval:
-19.0405455 -0.1594545
sample estimates:
mean in group A mean in group B
51.0 60.6
> #distribution = "exact",那么在零假设条件下,分布的计算是精确的(即依据所有
> #可能的排列组合),当前仅可用于两样本问题
> oneway_test(score~treatment, data=mydata, distribution='exact')
Exact Two-Sample Fisher-Pitman Permutation Test
data: score by treatment (A, B)
Z = -1.9147, p-value = 0.07143
alternative hypothesis: true mu is not equal to 0
>
> #测试美国南部与非南部的监禁概率
> library(MASS)
> UScrime <- transform(UScrime, So = factor(So))
> wilcox_test(Prob ~ So, data=UScrime, distribution="exact")
Exact Wilcoxon-Mann-Whitney Test
data: Prob by So (0, 1)
Z = -3.7493, p-value = 8.488e-05
alternative hypothesis: true mu is not equal to 0
> #监禁在南部可能更多
>
> #K样本问题, 五种治疗方案的差异性,参考分布得自于数据9999次的置换
> library(multcomp)
> set.seed(1234)
> oneway_test(response ~ trt, data = cholesterol, distribution=approximate(B=9999))
Approximative K-Sample Fisher-Pitman Permutation Test
data: response by trt (1time, 2times, 4times, drugD, drugE)
chi-squared = 36.381, p-value < 2.2e-16
>
>
> #列联表中的独立性
> #检验两类别型变量的独立性
> library(coin)
> library(vcd)
> #转换治疗效果变量为分类因子,有序因子coin会生产一个线性与线性的趋势检验,而不是卡方检验
> Arthritis <- transform(Arthritis, Improved=as.factor(as.numeric(Improved)))
> set.seed(1234)
> chisq_test(Treatment ~ Improved, data=Arthritis, distribution=approximate(B=9999))
Approximative Pearson Chi-Squared Test
data: Treatment by Improved (1, 2, 3)
chi-squared = 13.055, p-value = 0.0018
>
>
> #两数值型变量的独立性置换检验,文盲率与谋杀率
> #转换为数据框,x77是一个矩阵
> states <- as.data.frame(state.x77)
> set.seed(1234)
> spearman_test(Illiteracy~Murder, data=states, distribution=approximate(B=9999))
Approximative Spearman Correlation Test
data: Illiteracy by Murder
Z = 4.7065, p-value < 2.2e-16
alternative hypothesis: true rho is not equal to 0
>
> #两样本和K样本相关性检验
> library(coin)
> library(MASS)
> wilcoxsign_test(U1~U2, data=UScrime, distribution="exact")
Exact Wilcoxon-Pratt Signed-Rank Test
data: y by x (pos, neg)
stratified by block
Z = 5.9691, p-value = 1.421e-14
alternative hypothesis: true mu is not equal to 0

3、ImPerm包置换检验

1
2
3
4
5
6
7
8
9
10
11
12
13
14
15
16
17
18
19
20
21
22
23
24
25
26
27
28
29
30
31
32
33
34
35
36
37
38
39
40
41
42
43
44
45
46
47
48
49
50
51
52
53
54
55
56
57
58
59
60
61
62
63
64
65
66
67
68
69
70
71
72
73
74
75
76
77
78
79
80
81
82
83
84
85
86
87
88
89
90
91
92
93
94
95
96
97
98
99
100
101
102
103
104
105
106
107
108
109
110
111
112
113
114
115
116
117
118
119
120
121
122
123
124
125
126
#ImPerm包 提供线性模型的置换方法,回归和方差分析
> #简单回归
> library(lmPerm)
> fit<-lmp(weight~height, data=women, perm="Prob")
[1] "Settings: unique SS : numeric variables centered"
> summary(fit)
Call:
lmp(formula = weight ~ height, data = women, perm = "Prob")
Residuals:
Min 1Q Median 3Q Max
-1.7333 -1.1333 -0.3833 0.7417 3.1167
Coefficients:
Estimate Iter Pr(Prob)
height 3.45 5000 <2e-16 ***
---
Signif. codes: 0 ‘***’ 0.001 ‘**’ 0.01 ‘*’ 0.05 ‘.’ 0.1 ‘ ’ 1
Residual standard error: 1.525 on 13 degrees of freedom
Multiple R-Squared: 0.991, Adjusted R-squared: 0.9903
F-statistic: 1433 on 1 and 13 DF, p-value: 1.091e-14
>
> #多项式回归
> library(lmPerm)
> set.seed(1234)
> fit<-lmp(weight ~ height + I(height^2), data = women, perm = "Prob")
[1] "Settings: unique SS : numeric variables centered"
> summary(fit)
Call:
lmp(formula = weight ~ height + I(height^2), data = women, perm = "Prob")
Residuals:
Min 1Q Median 3Q Max
-0.509405 -0.296105 -0.009405 0.286151 0.597059
Coefficients:
Estimate Iter Pr(Prob)
height -7.34832 5000 <2e-16 ***
I(height^2) 0.08306 5000 <2e-16 ***
---
Signif. codes: 0 ‘***’ 0.001 ‘**’ 0.01 ‘*’ 0.05 ‘.’ 0.1 ‘ ’ 1
Residual standard error: 0.3841 on 12 degrees of freedom
Multiple R-Squared: 0.9995, Adjusted R-squared: 0.9994
F-statistic: 1.139e+04 on 2 and 12 DF, p-value: < 2.2e-16
>
>
> #多元回归
> library(lmPerm)
> set.seed(1234)
> states <- as.data.frame(state.x77)
> fit <- lmp(Murder ~ Population + Illiteracy + Income + Frost, data=states, perm="Prob")
[1] "Settings: unique SS : numeric variables centered"
> summary(fit)
Call:
lmp(formula = Murder ~ Population + Illiteracy + Income + Frost,
data = states, perm = "Prob")
Residuals:
Min 1Q Median 3Q Max
-4.79597 -1.64946 -0.08112 1.48150 7.62104
Coefficients:
Estimate Iter Pr(Prob)
Population 2.237e-04 51 1.0000
Illiteracy 4.143e+00 5000 0.0004 ***
Income 6.442e-05 51 1.0000
Frost 5.813e-04 51 0.8627
---
Signif. codes: 0 ‘***’ 0.001 ‘**’ 0.01 ‘*’ 0.05 ‘.’ 0.1 ‘ ’ 1
Residual standard error: 2.535 on 45 degrees of freedom
Multiple R-Squared: 0.567, Adjusted R-squared: 0.5285
F-statistic: 14.73 on 4 and 45 DF, p-value: 9.133e-08
>
> #单因素方差分析
> library(lmPerm)
> library(multcomp)
> set.seed(1234)
> fit <- aovp(response~trt, data=cholesterol, perm="Prob")
[1] "Settings: unique SS "
> summary(fit)
Component 1 :
Df R Sum Sq R Mean Sq Iter Pr(Prob)
trt 4 1351.37 337.84 5000 < 2.2e-16 ***
Residuals 45 468.75 10.42
---
Signif. codes: 0 ‘***’ 0.001 ‘**’ 0.01 ‘*’ 0.05 ‘.’ 0.1 ‘ ’ 1
>
> #单因素协方差分析
> library(lmPerm)
> set.seed(1234)
> fit <- aovp(weight ~ gesttime + dose, data=litter, perm="Prob")
[1] "Settings: unique SS : numeric variables centered"
> summary(fit)
Component 1 :
Df R Sum Sq R Mean Sq Iter Pr(Prob)
gesttime 1 161.49 161.493 5000 0.0006 ***
dose 3 137.12 45.708 5000 0.0392 *
Residuals 69 1151.27 16.685
---
Signif. codes: 0 ‘***’ 0.001 ‘**’ 0.01 ‘*’ 0.05 ‘.’ 0.1 ‘ ’ 1
>
> #双因素方差分析
> library(lmPerm)
> set.seed(1234)
> fit <- aovp(len ~ supp * dose, data=ToothGrowth, perm="Prob")
[1] "Settings: unique SS : numeric variables centered"
> summary(fit)
Component 1 :
Df R Sum Sq R Mean Sq Iter Pr(Prob)
supp 1 205.35 205.35 5000 < 2e-16 ***
dose 1 2224.30 2224.30 5000 < 2e-16 ***
supp:dose 1 88.92 88.92 2032 0.04724 *
Residuals 56 933.63 16.67
---
Signif. codes: 0 ‘***’ 0.001 ‘**’ 0.01 ‘*’ 0.05 ‘.’ 0.1 ‘ ’ 1

4、自助法

1
2
3
4
5
6
7
8
9
10
11
12
13
14
15
16
17
18
19
20
21
22
23
24
25
26
27
28
29
30
31
32
33
34
35
36
37
38
39
#boot包中的自助法,即通过一个函数重复执行多次取得统计量的序列分布
> #对单个统计量使用自助法
> rsq <- function(formula, data, indicates) {
+ d <- data[indicates,]
+ fit <- lm(formula, data=d)
+ return(summary(fit)$r.square)
+ }
> library(boot)
> set.seed(1234)
> results <- boot(data=mtcars, statistic = rsq, R=1000, formula=mpg~wt+disp)
>
> print(results)
ORDINARY NONPARAMETRIC BOOTSTRAP
Call:
boot(data = mtcars, statistic = rsq, R = 1000, formula = mpg ~
wt + disp)
Bootstrap Statistics :
original bias std. error
t1* 0.7809306 0.0133367 0.05068926
> plot(results)
#置信区间都不包含R平方值0,所以拒绝零假设
> boot.ci(results, type=c("perc", "bca"))
BOOTSTRAP CONFIDENCE INTERVAL CALCULATIONS
Based on 1000 bootstrap replicates
CALL :
boot.ci(boot.out = results, type = c("perc", "bca"))
Intervals :
Level Percentile BCa
95% ( 0.6838, 0.8833 ) ( 0.6344, 0.8549 )
Calculations and Intervals on Original Scale
Some BCa intervals may be unstable
>

1
2
3
4
5
6
7
8
9
10
11
12
13
14
15
16
17
18
19
20
21
22
23
24
25
26
27
28
29
30
31
32
33
34
35
36
37
38
39
40
41
42
43
44
45
46
47
48
49
50
51
52
> #多个统计量自助法
> bs <- function(formula, data, indices) {
+ d <- data[indices,]
+ fit <- lm(formula, data=d)
+ return(coef(fit))
+ }
>
> library(boot)
> set.seed(1234)
> results <- boot(data=mtcars, statistic = bs, R=1000, formula=mpg~wt+disp)
>
> print(results)
ORDINARY NONPARAMETRIC BOOTSTRAP
Call:
boot(data = mtcars, statistic = bs, R = 1000, formula = mpg ~
wt + disp)
Bootstrap Statistics :
original bias std. error
t1* 34.96055404 0.1378732942 2.485756673
t2* -3.35082533 -0.0539040965 1.170427539
t3* -0.01772474 -0.0001208075 0.008786803
> #查看车重的抽样结果
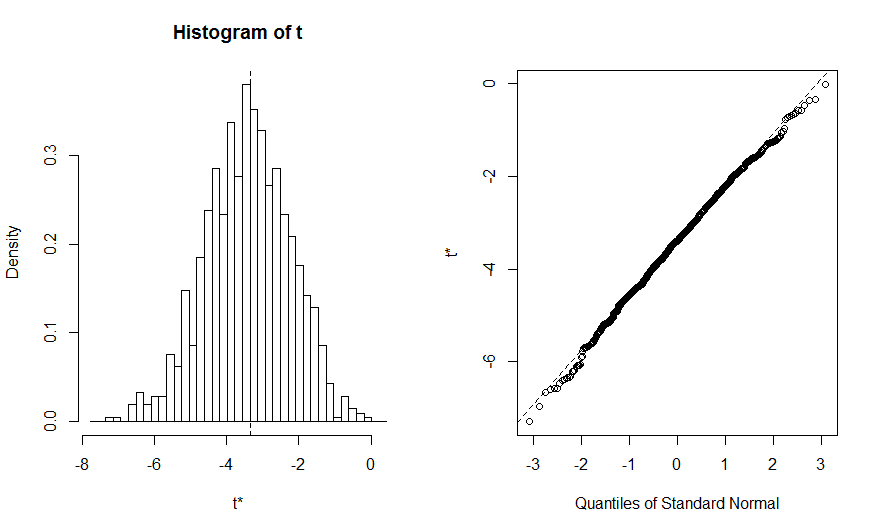
> plot(results, index=2)
> #查看车重的95置信区间
> boot.ci(results, type= "bca", index=2)
BOOTSTRAP CONFIDENCE INTERVAL CALCULATIONS
Based on 1000 bootstrap replicates
CALL :
boot.ci(boot.out = results, type = "bca", index = 2)
Intervals :
Level BCa
95% (-5.655, -1.194 )
Calculations and Intervals on Original Scale
> #查看排量的95置信区间
> boot.ci(results, type= "bca", index=3)
BOOTSTRAP CONFIDENCE INTERVAL CALCULATIONS
Based on 1000 bootstrap replicates
CALL :
boot.ci(boot.out = results, type = "bca", index = 3)
Intervals :
Level BCa
95% (-0.0331, 0.0010 )
Calculations and Intervals on Original Scale

文章目录
  1. 重抽样与自助法
    1. 1、置换检验
    2. 2、使用coin包进行置换检验
    3. 3、ImPerm包置换检验
    4. 4、自助法