高级图形进阶

1、lattice


1
2
3
4
5
6
7
library(lattice)
# Bass 男低音
# Alto 女低音
# Soprano 女高音
# Tenor 男高音
histogram(~height|voice.part, data = singer, main="合唱团身高和声部的分布", xlab="身高(英尺)")


1
2
3
4
5
6
7
8
9
#lattice包绘图的基本形式
#graph_function(formula, data = , options)
library(lattice)
attach(mtcars)
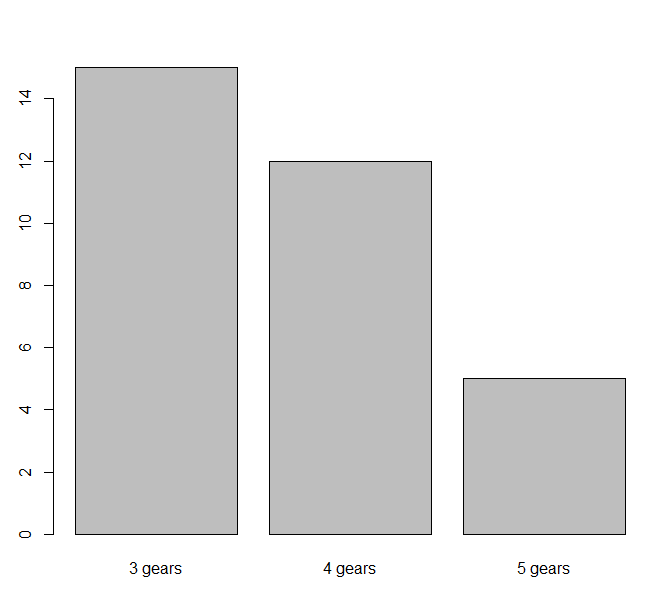
gearPlot <- factor(mtcars$gear, levels = c(3, 4, 5),
labels = c("3 gears", "4 gears", "5 gears"))
plot(gearPlot)


1
2
3
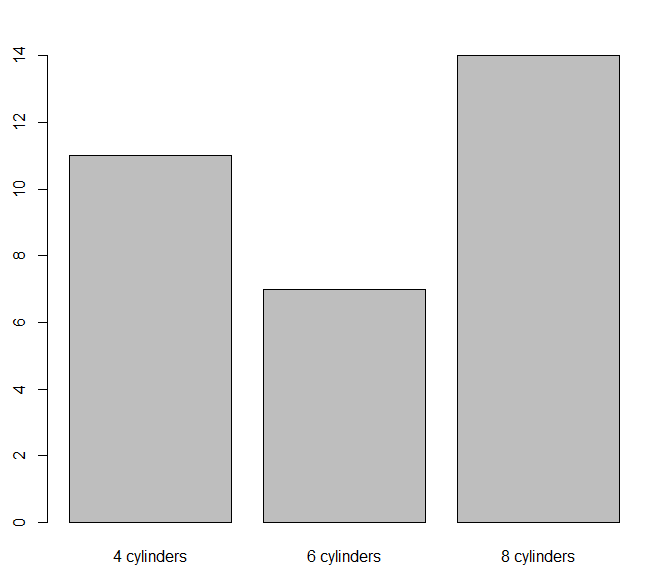
cylPlot <- factor(mtcars$cyl, levels = c(4, 6, 8),
labels = c("4 cylinders", "6 cylinders", "8 cylinders"))
plot(cylPlot)


1
2
densityplot(~mpg,
main = "核密度图", xlab = "每加仑的英里数")


1
2
3
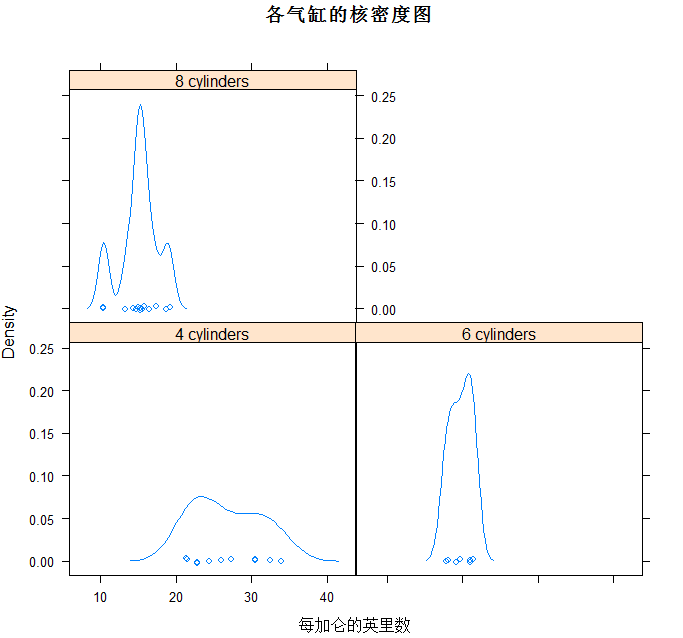
densityplot(~mpg | cyl,
main = "各气缸的核密度图",
xlab = "每加仑的英里数")


1
2
3
bwplot(cyl ~ mpg | gear,
main = "气缸和档数的箱线图",
xlab = "英里每加仑", ylab = "气缸数")


1
2
3
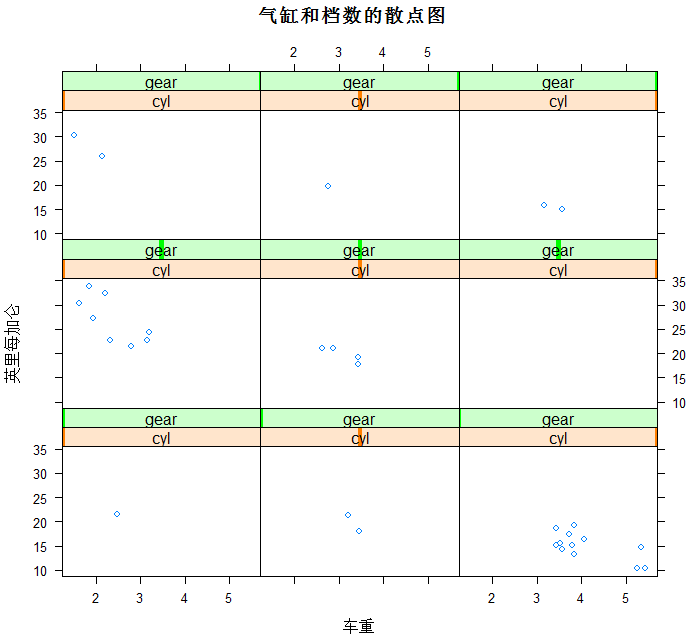
xyplot(mpg ~ wt | cyl * gear,
main = "气缸和档数的散点图",
xlab = "车重", ylab = "英里每加仑")


1
2
3
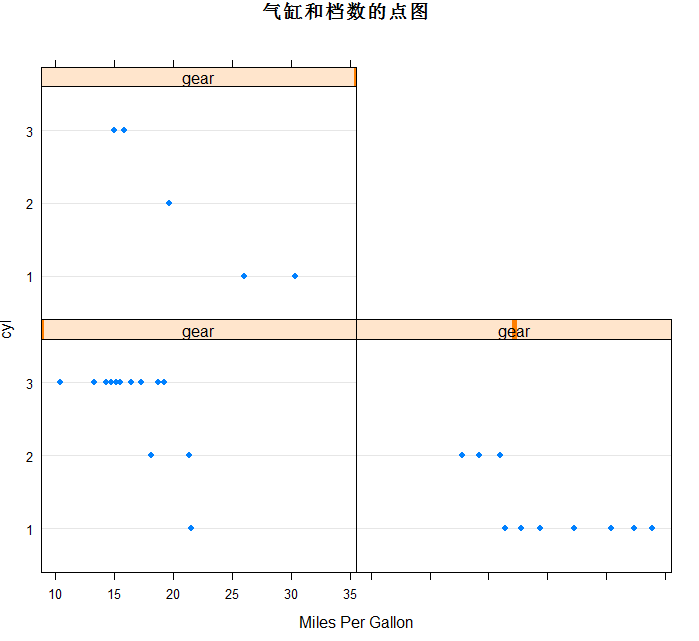
dotplot(cyl ~ mpg | gear,
main = "气缸和档数的点图",
xlab = "Miles Per Gallon")


1
2
cloud(mpg ~ wt * qsec | cyl,
main = "各气缸的3D散点图")


1
2
3
4
5
splom(mtcars[c(1, 3, 4, 5, 6)],
main = "散点矩阵图")
detach(mtcars)


1
2
3
4
#修改图形
myg <-densityplot(~height | voice.part, data=singer)
#更新为红色的点,加粗的线,填充的点
update(myg, col="red", pch=16, cex=.8, lwd=2)

1、条件变量

1
2
3
4
5
6
7
# 针对连续形变量先切割成瓦块可以作为条件变量进行分析
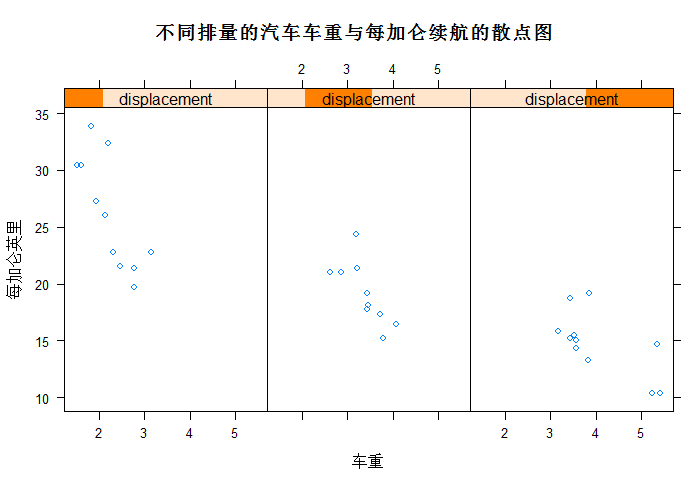
displacement <- equal.count(mtcars$disp, number = 3,
overlap = 0)
xyplot(mpg ~ wt | displacement, data = mtcars,
main = "不同排量的汽车车重与每加仑续航的散点图",
xlab = "车重", ylab = "每加仑英里",
layout = c(3, 1), aspect = 1.5)

2、面板函数

1
2
3
4
5
6
7
8
9
10
11
12
13
14
15
displacement <- equal.count(mtcars$disp, number = 3,
overlap = 0)
# 自定义的面板函数,使用该函数进行图形绘制,添加轴须线,网格,回归线
mypanel <- function(x, y) {
panel.xyplot(x, y, pch = 19)
panel.rug(x, y)
panel.grid(h = -1, v = -1)
#回归线
panel.lmline(x, y, col = "red", lwd = 1, lty = 2)
}
xyplot(mpg ~ wt | displacement, data = mtcars,
layout = c(3, 1), aspect = 1.5,
main = "不同排量的汽车车重与每加仑续航的散点图(自定义面板函数)",
xlab = "车重", ylab = "每加仑英里", panel = mypanel)

1
2
3
4
5
6
7
8
9
10
11
12
13
14
15
16
17
18
19
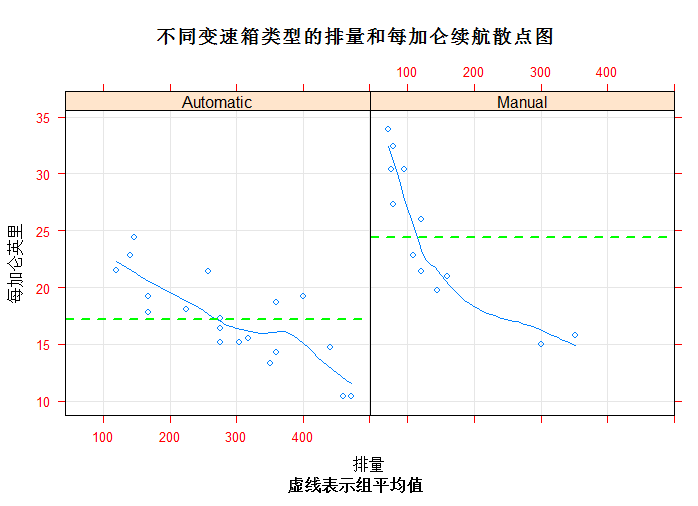
# 自定义的面板函数,使用该函数进行图形绘制,添加平均线,网格,平滑曲线
library(lattice)
mtcars$transmission <- factor(mtcars$am,
levels = c(0, 1), labels = c("Automatic", "Manual"))
panel.smoother <- function(x, y) {
panel.grid(h = -1, v = -1)
panel.xyplot(x, y)
panel.loess(x, y)
panel.abline(h = mean(y), lwd = 2, lty = 2, col = "green")
}
xyplot(mpg ~ disp | transmission, data = mtcars, scales = list(cex = 0.8,
col = "red"),
panel = panel.smoother,
xlab = "排量",
ylab = "每加仑英里",
main = "不同变速箱类型的排量和每加仑续航散点图",
sub = "虚线表示组平均值", aspect = 1)

3、分组变量,多个面板的数据合一

1
2
3
4
5
6
7
8
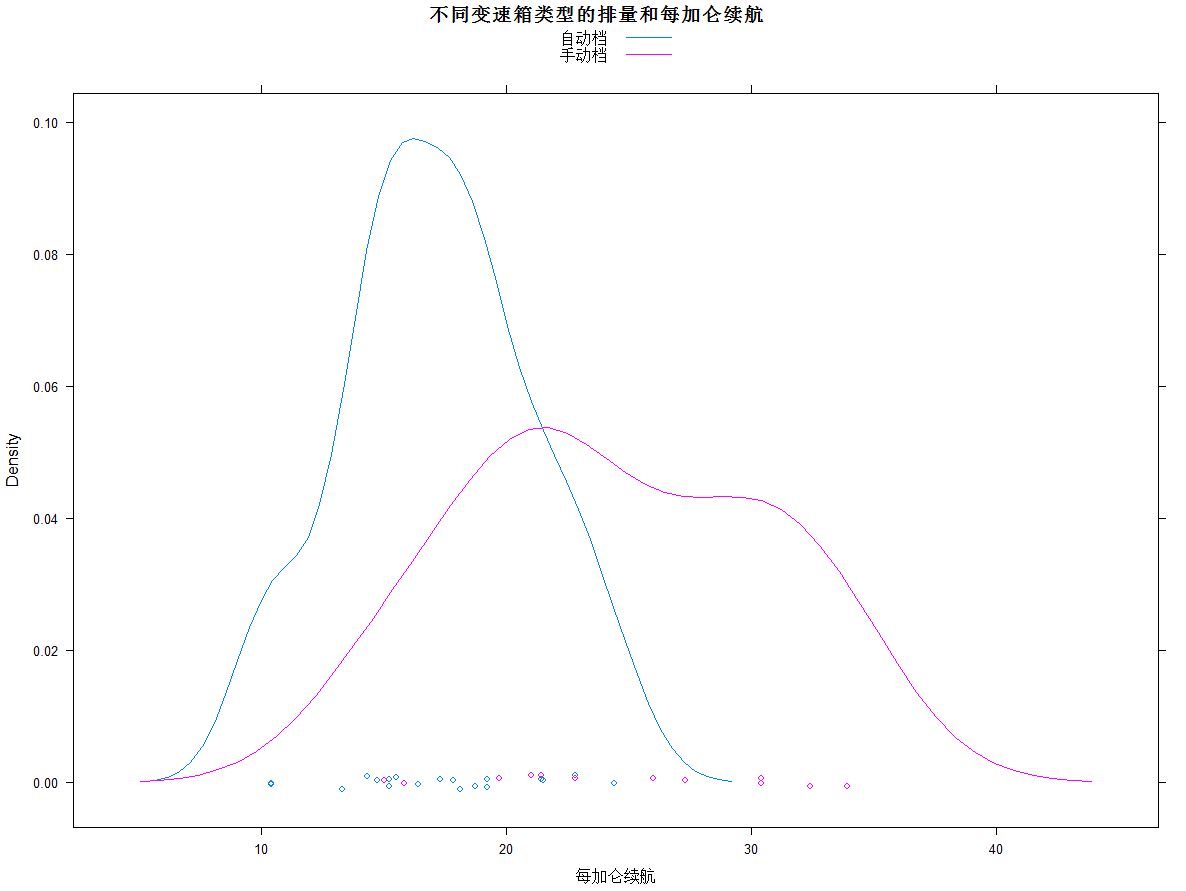
library(lattice)
mtcars$transmission <- factor(mtcars$am, levels = c(0, 1),
labels = c("自动档", "手动档"))
densityplot(~mpg, data = mtcars,
group = transmission,
main = "不同变速箱类型的排量和每加仑续航",
xlab = "每加仑续航",
auto.key = TRUE)

1
2
3
4
5
6
7
8
9
10
11
12
13
14
15
16
17
18
19
20
21
22
23
24
25
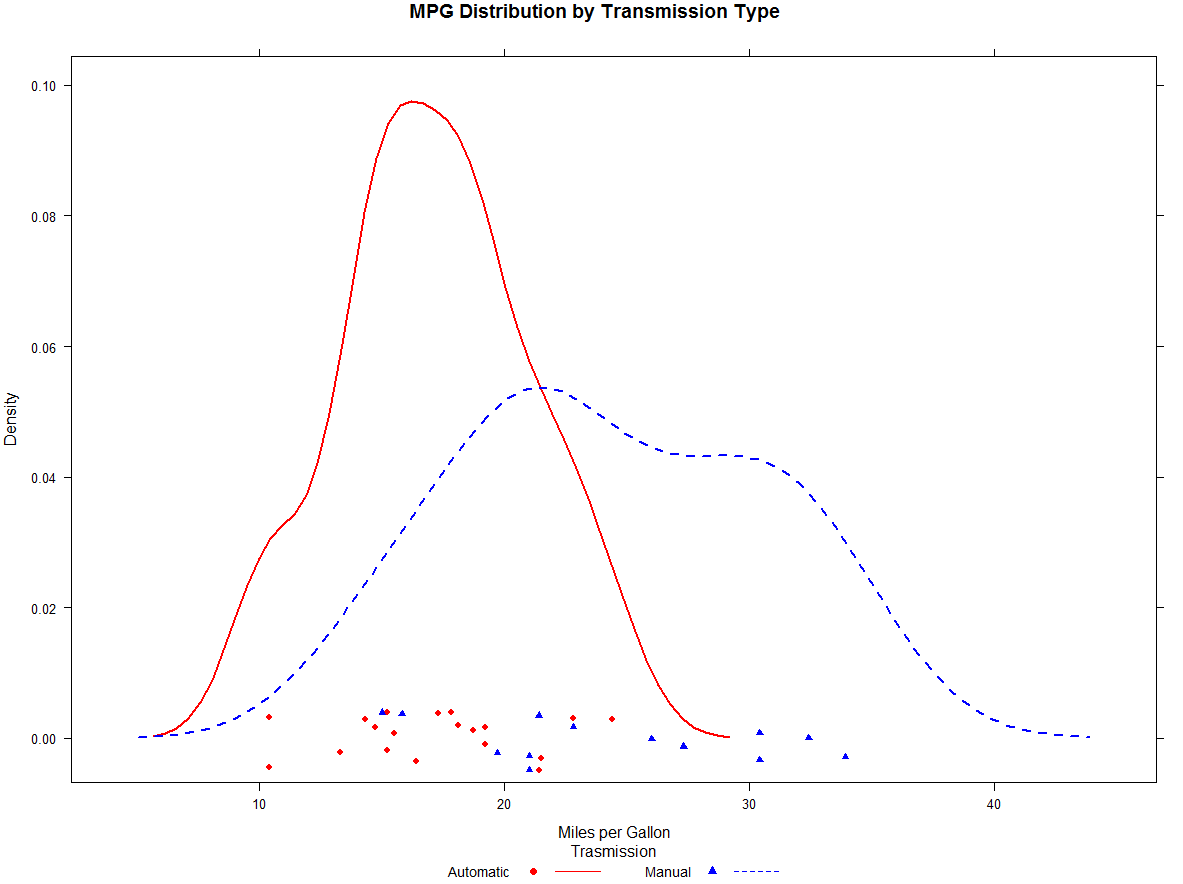
# 自定义图例
library(lattice)
mtcars$transmission <- factor(mtcars$am, levels = c(0, 1),
labels = c("Automatic", "Manual"))
colors = c("red", "blue")
lines = c(1, 2)
points = c(16, 17)
key.trans <- list(title = "传动方式",
space = "bottom", columns = 2,
text = list(levels(mtcars$transmission)),
points = list(pch = points, col = colors),
lines = list(col = colors, lty = lines),
cex.title = 1, cex = 0.9)
densityplot(~mpg, data = mtcars,
group = transmission,
main = "不同变速箱类型的排量和每加仑续航",
xlab = "每加仑续航",
pch = points, lty = lines, col = colors,
lwd = 2, jitter = 0.005,
key = key.trans)

1
2
3
4
5
6
7
8
9
10
11
12
13
14
15
16
17
18
19
20
21
22
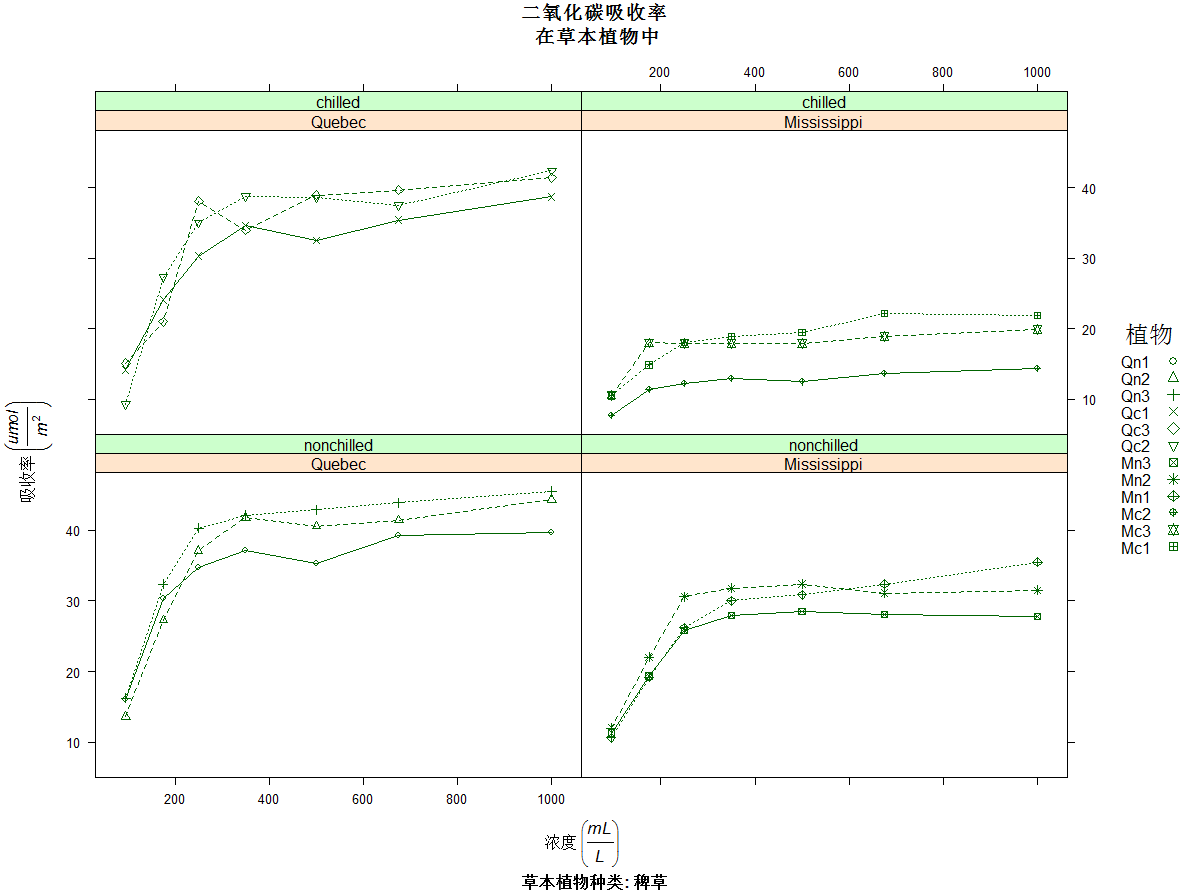
## 复合使用-分组变量和条件变量
library(lattice)
colors <- "darkgreen"
symbols <- c(1:12)
linetype <- c(1:3)
key.species <- list(title = "植物",
space = "right",
text = list(levels(CO2$Plant)),
points = list(pch = symbols, col = colors))
xyplot(uptake ~ conc | Type * Treatment, data = CO2,
group = Plant,
type = "o",
pch = symbols, col = colors, lty = linetype,
main = "二氧化碳吸收率\n 在草本植物中",
ylab = expression(paste("吸收率 ",
bgroup("(", italic(frac("umol", "m"^2)), ")"))),
xlab = expression(paste("浓度 ",
bgroup("(", italic(frac(mL, L)), ")"))),
sub = "草本植物种类: 稗草",
key = key.species)

4、lattice的图形参数

1
2
3
4
5
6
7
8
9
10
#通过trellis.par.get()函数来获取,并用trellis.par.set()函数来修改。
#show.settings()函数可展示当前的图形参数设置情况
show.settings()
mysettings <- trellis.par.get()
mysettings$superpose.symbol
mysettings$superpose.symbol$pch <- c(1:10)
trellis.par.set(mysettings)
#此时lattice图形将对分组变量的第一个水平使用符号1(空心圆圈),第二个使用符号2(空心三角形),
#以此类推。
show.settings()

5、图形摆放

1
2
3
4
5
6
7
8
9
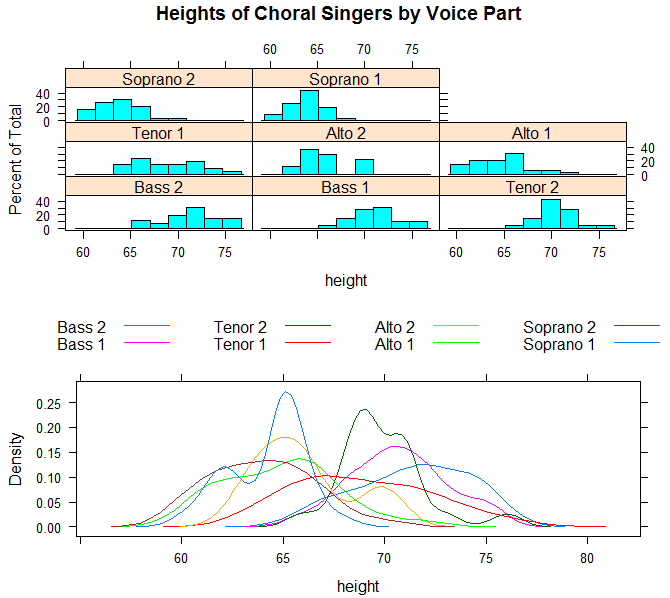
library(lattice)
graph1 <- histogram(~height | voice.part, data = singer,
main = "Heights of Choral Singers by Voice Part")
graph2 <- densityplot(~height, data = singer, group = voice.part,
plot.points = FALSE, auto.key = list(columns = 4))
#第一个plot()函数把页面分割成一列两行的矩阵,并将图形放置到第一列、第一行中(自上往下、从左至右地计数)
plot(graph1, split = c(1, 1, 1, 2))
#第二个plot()函数做同样的分割,但是把图形放置到第一列、第二行中
plot(graph2, split = c(1, 2, 1, 2), newpage = FALSE)


1
2
3
4
5
6
7
8
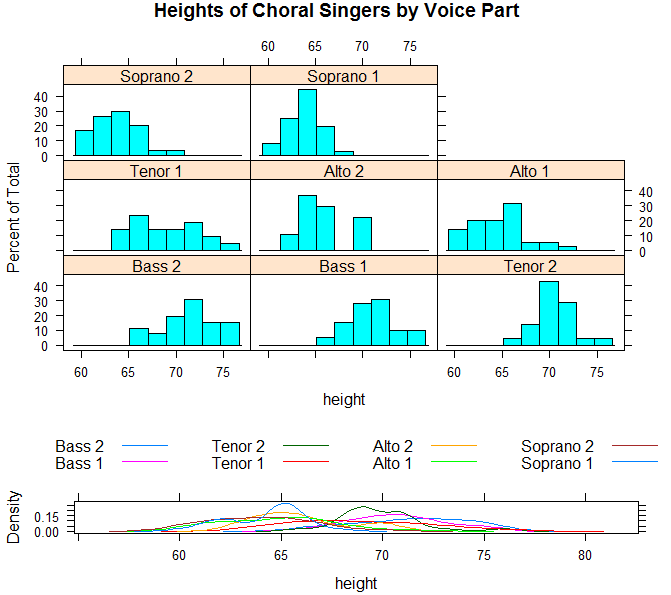
library(lattice)
graph1 <- histogram(~height | voice.part, data = singer,
main = "Heights of Choral Singers by Voice Part")
graph2 <- densityplot(~height, data = singer, group = voice.part,
plot.points = FALSE, auto.key = list(columns = 4))
#position = c(xmin, ymin, xmax, ymax)
plot(graph1, position = c(0, 0.3, 1, 1))
plot(graph2, position = c(0, 0, 1, 0.3), newpage = FALSE)

2、ggplot2包

1
2
3
4
5
6
7
8
##箱线散点图
library(ggplot2)
mtcars$cylinder <- as.factor(mtcars$cyl)
qplot(cylinder, mpg, data=mtcars, geom=c("boxplot", "jitter"),
fill=cylinder,
main="叠加数据点的箱线图",
xlab= "气缸数",
ylab="每加仑续航")


1
2
3
4
5
6
7
8
9
10
#回归图,并绘制了置信区间带
library(ggplot2)
transmission <- factor(mtcars$am, levels = c(0, 1),
labels = c("自动", "手动"))
qplot(wt, mpg, data = mtcars,
color = transmission, shape = transmission,
geom = c("point", "smooth"),
method = "lm", formula = y ~ x,
xlab = "车重", ylab = "每加仑续航",
main = "回归示例")


1
2
3
4
5
6
7
#栅栏图
library(ggplot2)
mtcars$cyl <- factor(mtcars$cyl, levels = c(4, 6, 8),
labels = c("4 cylinders", "6 cylinders", "8 cylinders"))
mtcars$am <- factor(mtcars$am, levels = c(0, 1),
labels = c("Automatic", "Manual"))
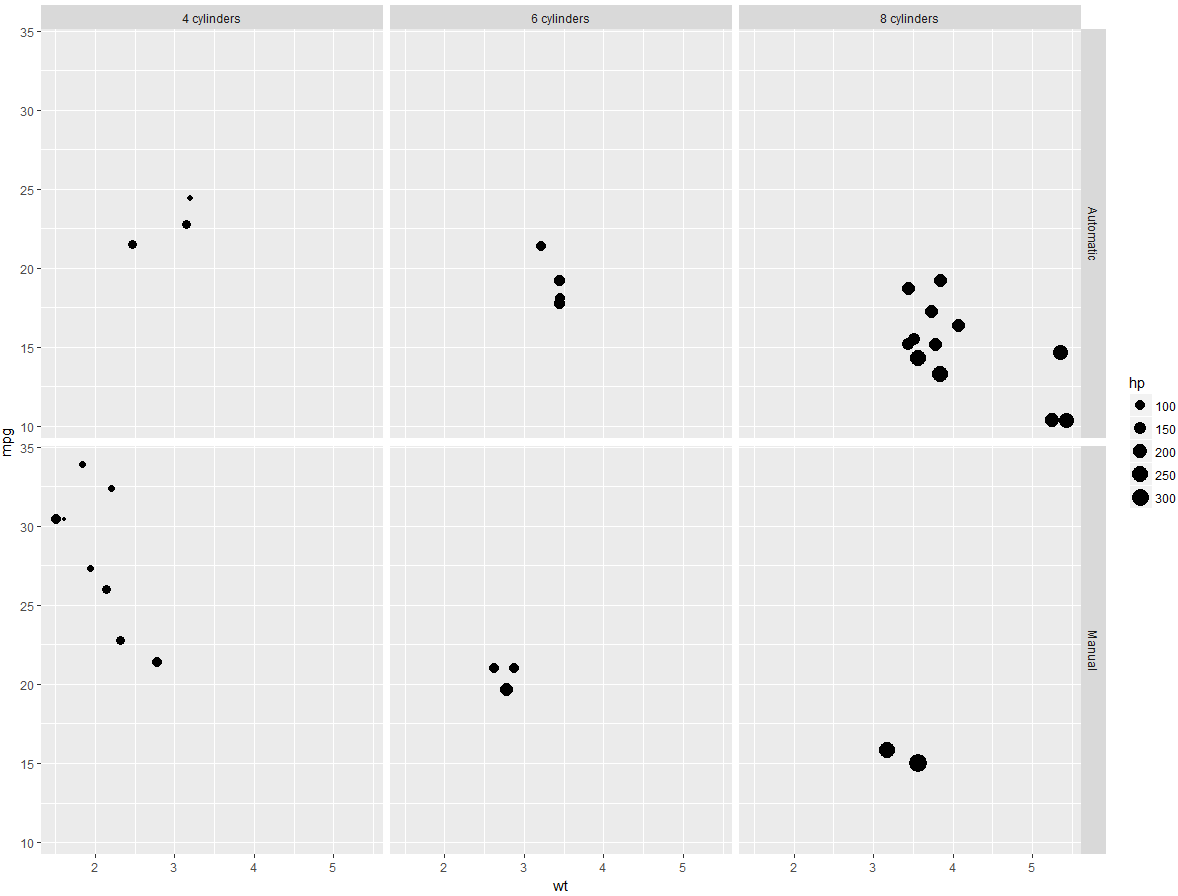
qplot(wt, mpg, data = mtcars, facets = am ~ cyl, size = hp)


1
2
3
4
5
6
library(ggplot2)
data(singer, package = "lattice")
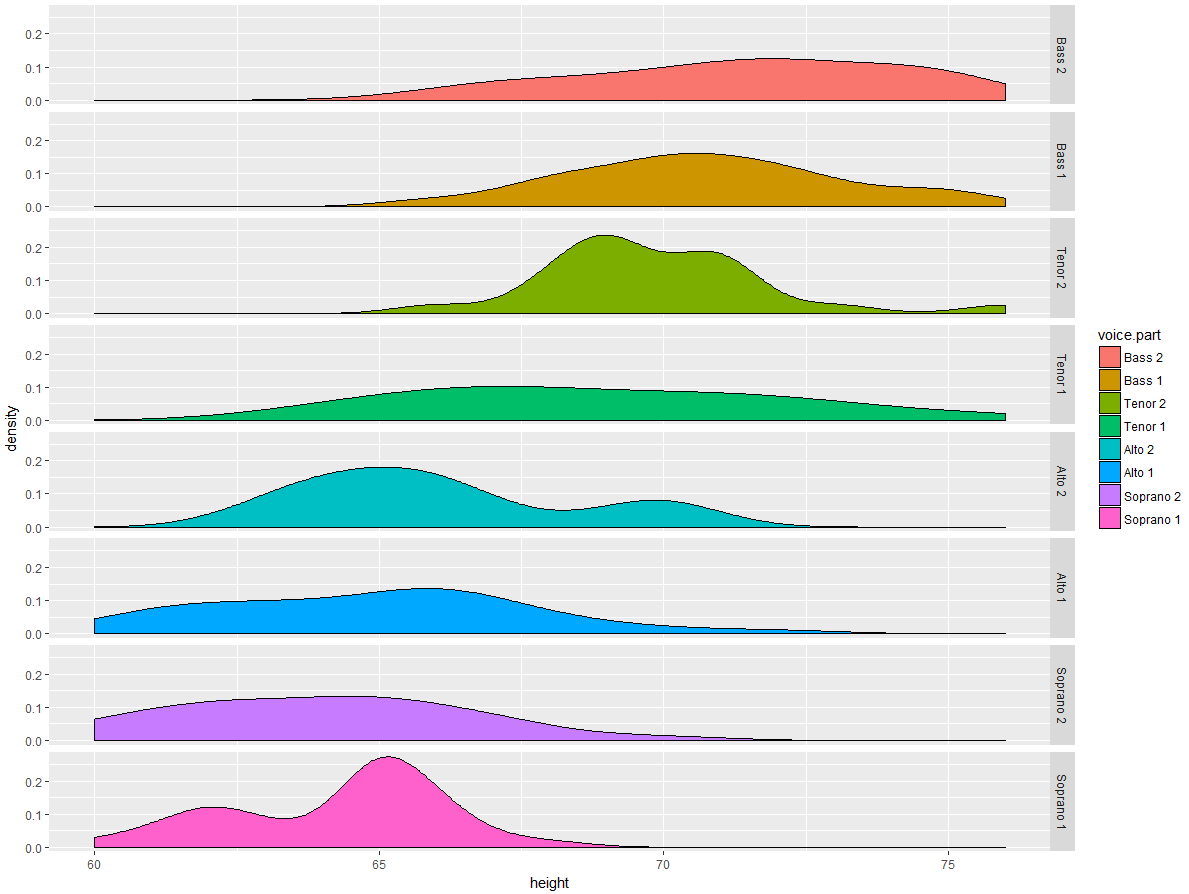
qplot(height, data = singer, geom = c("density"),
facets = voice.part ~ ., fill = voice.part)
#更多请关注 http://ggplot2.tidyverse.org

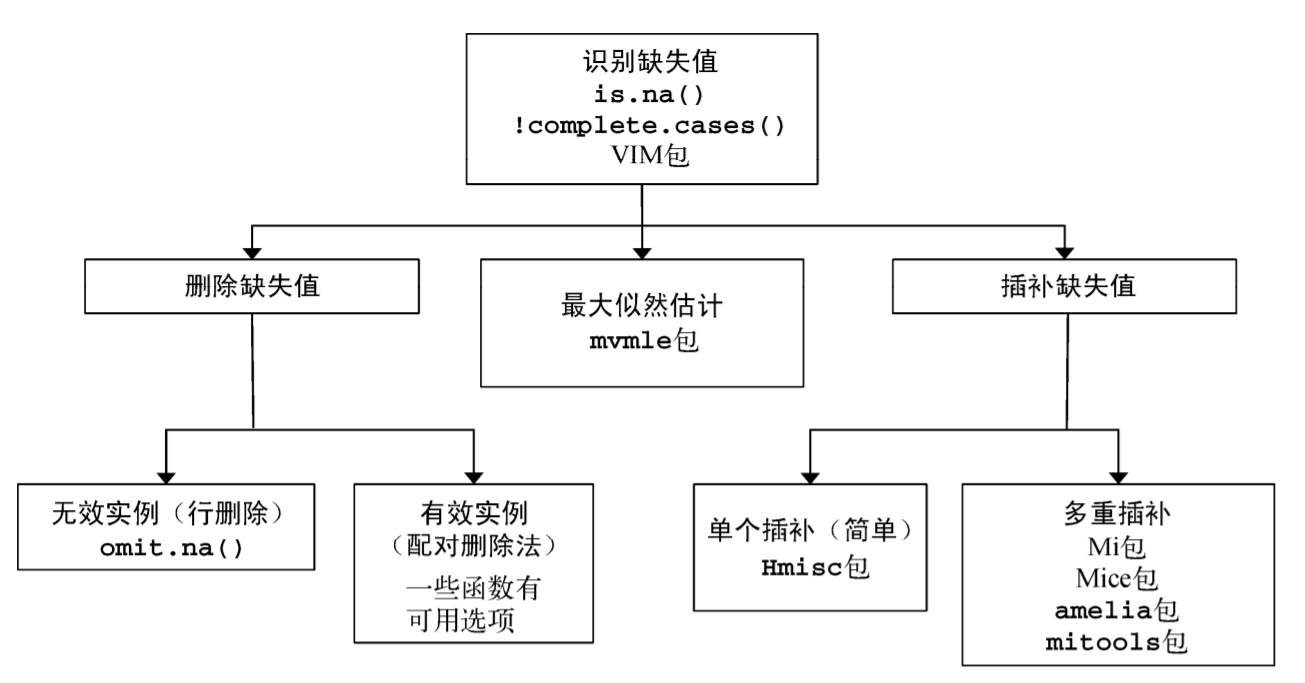
处理缺失数据的高级方法

1、步骤

1
2
3
4
5
> ##缺失值的处理
> #1、步骤
> #(1) 识别缺失数据;
> #(2) 检查导致数据缺失的原因;
> #(3) 删除包含缺失值的实例或用合理的数值代替(插补)缺失值

2、识别

1
2
3
4
5
6
7
8
9
10
11
12
13
14
15
16
17
18
19
20
21
22
23
24
25
26
27
28
29
30
31
32
33
34
35
36
37
38
39
40
41
42
43
44
45
46
47
48
49
50
51
52
53
54
55
56
57
58
59
60
61
62
63
64
65
66
67
68
69
70
71
72
73
74
75
76
77
78
79
80
81
82
83
84
> #2、识别
> #R使用NA(不可得)代表缺失值, NaN(不是一个数)代表不可能的值。另外,符号Inf和-Inf分别代表正无穷和负无穷。函数is.na()、
> #is.nan()和is.infinite()可分别用来识别缺失值、不可能值和无穷值
> data(sleep, package="VIM")
> #列出完整值
> sleep[complete.cases(sleep),]
BodyWgt BrainWgt NonD Dream Sleep Span Gest Pred Exp Danger
2 1.000 6.60 6.3 2.0 8.3 4.5 42.0 3 1 3
5 2547.000 4603.00 2.1 1.8 3.9 69.0 624.0 3 5 4
6 10.550 179.50 9.1 0.7 9.8 27.0 180.0 4 4 4
7 0.023 0.30 15.8 3.9 19.7 19.0 35.0 1 1 1
8 160.000 169.00 5.2 1.0 6.2 30.4 392.0 4 5 4
9 3.300 25.60 10.9 3.6 14.5 28.0 63.0 1 2 1
10 52.160 440.00 8.3 1.4 9.7 50.0 230.0 1 1 1
11 0.425 6.40 11.0 1.5 12.5 7.0 112.0 5 4 4
12 465.000 423.00 3.2 0.7 3.9 30.0 281.0 5 5 5
15 0.075 1.20 6.3 2.1 8.4 3.5 42.0 1 1 1
16 3.000 25.00 8.6 0.0 8.6 50.0 28.0 2 2 2
17 0.785 3.50 6.6 4.1 10.7 6.0 42.0 2 2 2
18 0.200 5.00 9.5 1.2 10.7 10.4 120.0 2 2 2
22 27.660 115.00 3.3 0.5 3.8 20.0 148.0 5 5 5
23 0.120 1.00 11.0 3.4 14.4 3.9 16.0 3 1 2
25 85.000 325.00 4.7 1.5 6.2 41.0 310.0 1 3 1
27 0.101 4.00 10.4 3.4 13.8 9.0 28.0 5 1 3
28 1.040 5.50 7.4 0.8 8.2 7.6 68.0 5 3 4
29 521.000 655.00 2.1 0.8 2.9 46.0 336.0 5 5 5
32 0.005 0.14 7.7 1.4 9.1 2.6 21.5 5 2 4
33 0.010 0.25 17.9 2.0 19.9 24.0 50.0 1 1 1
34 62.000 1320.00 6.1 1.9 8.0 100.0 267.0 1 1 1
37 0.023 0.40 11.9 1.3 13.2 3.2 19.0 4 1 3
38 0.048 0.33 10.8 2.0 12.8 2.0 30.0 4 1 3
39 1.700 6.30 13.8 5.6 19.4 5.0 12.0 2 1 1
40 3.500 10.80 14.3 3.1 17.4 6.5 120.0 2 1 1
42 0.480 15.50 15.2 1.8 17.0 12.0 140.0 2 2 2
43 10.000 115.00 10.0 0.9 10.9 20.2 170.0 4 4 4
44 1.620 11.40 11.9 1.8 13.7 13.0 17.0 2 1 2
45 192.000 180.00 6.5 1.9 8.4 27.0 115.0 4 4 4
46 2.500 12.10 7.5 0.9 8.4 18.0 31.0 5 5 5
48 0.280 1.90 10.6 2.6 13.2 4.7 21.0 3 1 3
49 4.235 50.40 7.4 2.4 9.8 9.8 52.0 1 1 1
50 6.800 179.00 8.4 1.2 9.6 29.0 164.0 2 3 2
51 0.750 12.30 5.7 0.9 6.6 7.0 225.0 2 2 2
52 3.600 21.00 4.9 0.5 5.4 6.0 225.0 3 2 3
54 55.500 175.00 3.2 0.6 3.8 20.0 151.0 5 5 5
57 0.900 2.60 11.0 2.3 13.3 4.5 60.0 2 1 2
58 2.000 12.30 4.9 0.5 5.4 7.5 200.0 3 1 3
59 0.104 2.50 13.2 2.6 15.8 2.3 46.0 3 2 2
60 4.190 58.00 9.7 0.6 10.3 24.0 210.0 4 3 4
61 3.500 3.90 12.8 6.6 19.4 3.0 14.0 2 1 1
> #列出存在缺失值的行
> sleep[!complete.cases(sleep),]
BodyWgt BrainWgt NonD Dream Sleep Span Gest Pred Exp Danger
1 6654.000 5712.0 NA NA 3.3 38.6 645 3 5 3
3 3.385 44.5 NA NA 12.5 14.0 60 1 1 1
4 0.920 5.7 NA NA 16.5 NA 25 5 2 3
13 0.550 2.4 7.6 2.7 10.3 NA NA 2 1 2
14 187.100 419.0 NA NA 3.1 40.0 365 5 5 5
19 1.410 17.5 4.8 1.3 6.1 34.0 NA 1 2 1
20 60.000 81.0 12.0 6.1 18.1 7.0 NA 1 1 1
21 529.000 680.0 NA 0.3 NA 28.0 400 5 5 5
24 207.000 406.0 NA NA 12.0 39.3 252 1 4 1
26 36.330 119.5 NA NA 13.0 16.2 63 1 1 1
30 100.000 157.0 NA NA 10.8 22.4 100 1 1 1
31 35.000 56.0 NA NA NA 16.3 33 3 5 4
35 0.122 3.0 8.2 2.4 10.6 NA 30 2 1 1
36 1.350 8.1 8.4 2.8 11.2 NA 45 3 1 3
41 250.000 490.0 NA 1.0 NA 23.6 440 5 5 5
47 4.288 39.2 NA NA 12.5 13.7 63 2 2 2
53 14.830 98.2 NA NA 2.6 17.0 150 5 5 5
55 1.400 12.5 NA NA 11.0 12.7 90 2 2 2
56 0.060 1.0 8.1 2.2 10.3 3.5 NA 3 1 2
62 4.050 17.0 NA NA NA 13.0 38 3 1 1
>
> #缺失值的统计
> sum(is.na(sleep$Dream))
[1] 12
>
> #缺失值的占比 is.na转换为布尔数组后计算true的数量(逻辑值TRUE和FALSE分别等价于数值1和0)
> mean(is.na(sleep$Dream))
[1] 0.1935484
> #计算存在缺失值的比例
> #complete.cases()函数仅将NA和NaN识别为缺失值,无穷值(Inf和-Inf)被当做有效值
> mean(!complete.cases(sleep))
[1] 0.3225806

3、探索缺失值模式

1
2
3
4
5
6
7
8
9
10
11
12
13
14
15
16
17
18
19
20
21
22
23
24
25
26
27
28
29
30
31
32
33
34
35
36
> #探索缺失值
> library(mice)
> data(sleep, package="VIM")
> #表中1和0显示了缺失值模式, 0表示变量的列中有缺失值, 1则表示没有缺失值。
> #左侧是这种模式的计数。比如第一行为全部没有缺失值的行数
> md.pattern(sleep)
BodyWgt BrainWgt Pred Exp Danger Sleep Span Gest Dream NonD
42 1 1 1 1 1 1 1 1 1 1 0
2 1 1 1 1 1 1 0 1 1 1 1
3 1 1 1 1 1 1 1 0 1 1 1
9 1 1 1 1 1 1 1 1 0 0 2
2 1 1 1 1 1 0 1 1 1 0 2
1 1 1 1 1 1 1 0 0 1 1 2
2 1 1 1 1 1 0 1 1 0 0 3
1 1 1 1 1 1 1 0 1 0 0 3
0 0 0 0 0 4 4 4 12 14 38
> library(VIM)
>
> #图形方式展现缺失值的模式与数量
> aggr(sleep, prop=FALSE, numbers=TRUE)
> aggr(sleep, prop=TRUE, numbers=TRUE)
>
> #相关性探索缺失值
> #你可用指示变量替代数据集中的数据(1表示缺失,0表示存在),这样生成的矩阵有时称作影子矩阵
> x <- data.frame(abs(is.na(sleep[!complete.cases(sleep),])))
>
> #提取含(但不全部是)缺失值的变量
> y <- x[which(colSums(x) >0)]
> #相关性
> cor(y)
NonD Dream Sleep Span Gest
NonD 1.0000000 0.8017837 0.3273268 -0.4909903 -0.7637626
Dream 0.8017837 1.0000000 -0.1020621 -0.3572173 -0.6123724
Sleep 0.3273268 -0.1020621 1.0000000 -0.2500000 -0.2500000
Span -0.4909903 -0.3572173 -0.2500000 1.0000000 0.0625000
Gest -0.7637626 -0.6123724 -0.2500000 0.0625000 1.0000000


4、缺失值处理

1、删除

1
2
3
4
5
6
> #4、缺失值处理
>
> #删除
> newdata <- sleep[complete.cases(sleep),]
>
> newdata <- na.omit(sleep)

2、多重插补

1
2
3
4
5
6
7
8
9
10
11
12
13
14
15
16
17
18
19
20
21
22
23
24
25
26
27
28
29
30
31
32
33
34
35
36
37
38
39
40
41
42
43
44
45
46
47
48
49
50
51
52
53
54
55
56
57
58
59
60
61
62
63
64
65
66
67
68
69
70
71
72
73
74
75
76
77
78
79
80
81
82
83
84
85
86
87
88
89
90
91
92
93
94
95
96
97
98
99
100
101
102
103
104
105
106
107
108
109
110
111
112
113
114
115
116
117
118
119
120
121
122
123
124
125
126
127
128
129
130
131
132
133
134
135
136
137
> #多重插补
> library(mice)
>
> #mydata是一个包含缺失值的矩阵或数据框。
> # imp是一个包含m个插补数据集的列表对象,同时还含有完成插补过程的信息。默认地,m为5。
> # analysis是一个表达式对象,用来设定应用于m个插补数据集的统计分析方法。方法包
> #括做线性回归模型的lm()函数、做广义线性模型的glm()函数、做广义可加模型的
> #gam(),以及做负二项模型的nbrm()函数。 表达式在函数的括号中, ~的左边是响应变量,
> #右边是预测变量(用+符号分隔开)。
> # fit是一个包含m个单独统计分析结果的列表对象。
> # pooled是一个包含这m个统计分析平均结果的列表对象
> data(sleep, package="VIM")
> imp <- mice(sleep, seed=1234)
iter imp variable
1 1 NonD Dream Sleep Span Gest
1 2 NonD Dream Sleep Span Gest
1 3 NonD Dream Sleep Span Gest
1 4 NonD Dream Sleep Span Gest
1 5 NonD Dream Sleep Span Gest
2 1 NonD Dream Sleep Span Gest
2 2 NonD Dream Sleep Span Gest
2 3 NonD Dream Sleep Span Gest
2 4 NonD Dream Sleep Span Gest
2 5 NonD Dream Sleep Span Gest
3 1 NonD Dream Sleep Span Gest
3 2 NonD Dream Sleep Span Gest
3 3 NonD Dream Sleep Span Gest
3 4 NonD Dream Sleep Span Gest
3 5 NonD Dream Sleep Span Gest
4 1 NonD Dream Sleep Span Gest
4 2 NonD Dream Sleep Span Gest
4 3 NonD Dream Sleep Span Gest
4 4 NonD Dream Sleep Span Gest
4 5 NonD Dream Sleep Span Gest
5 1 NonD Dream Sleep Span Gest
5 2 NonD Dream Sleep Span Gest
5 3 NonD Dream Sleep Span Gest
5 4 NonD Dream Sleep Span Gest
5 5 NonD Dream Sleep Span Gest
>
> fit <- with(imp, lm(Dream ~ Span + Gest))
>
> pooled <- pool(fit)
>
> summary(pooled)
est se t df Pr(>|t|) lo 95 hi 95
(Intercept) 2.546199168 0.254689696 9.997260 52.12563 1.021405e-13 2.035156222 3.0572421151
Span -0.004548904 0.012039106 -0.377844 51.94538 7.070861e-01 -0.028707741 0.0196099340
Gest -0.003916211 0.001468788 -2.666287 55.55683 1.002562e-02 -0.006859066 -0.0009733567
nmis fmi lambda
(Intercept) NA 0.08710301 0.05273554
Span 4 0.08860195 0.05417409
Gest 4 0.05442170 0.02098354
>
> #展示了在Dream变量上有缺失值的12个动物的5次插补值。
> imp$imp$Dream
1 2 3 4 5
1 1.0 0.5 0.5 0.5 0.3
3 2.6 2.1 1.5 1.8 1.3
4 3.4 3.1 3.4 1.2 3.4
14 0.3 0.5 0.5 0.3 1.2
24 1.8 1.3 3.6 0.9 5.6
26 2.3 3.1 2.0 2.6 2.1
30 1.2 0.3 3.4 2.6 2.3
31 3.4 0.5 0.6 1.0 0.5
47 0.5 1.5 1.5 2.2 3.4
53 0.3 0.5 0.5 0.5 0.6
55 0.5 0.9 2.6 2.7 2.4
62 1.0 2.1 0.5 3.9 3.6
>
>
> #利用complete()函数可以观察m个插补数据集中的任意一个。
> complete(imp,action=1)
BodyWgt BrainWgt NonD Dream Sleep Span Gest Pred Exp Danger
1 6654.000 5712.00 3.3 1.0 3.3 38.6 645.0 3 5 3
2 1.000 6.60 6.3 2.0 8.3 4.5 42.0 3 1 3
3 3.385 44.50 9.7 2.6 12.5 14.0 60.0 1 1 1
4 0.920 5.70 13.2 3.4 16.5 4.7 25.0 5 2 3
5 2547.000 4603.00 2.1 1.8 3.9 69.0 624.0 3 5 4
6 10.550 179.50 9.1 0.7 9.8 27.0 180.0 4 4 4
7 0.023 0.30 15.8 3.9 19.7 19.0 35.0 1 1 1
8 160.000 169.00 5.2 1.0 6.2 30.4 392.0 4 5 4
9 3.300 25.60 10.9 3.6 14.5 28.0 63.0 1 2 1
10 52.160 440.00 8.3 1.4 9.7 50.0 230.0 1 1 1
11 0.425 6.40 11.0 1.5 12.5 7.0 112.0 5 4 4
12 465.000 423.00 3.2 0.7 3.9 30.0 281.0 5 5 5
13 0.550 2.40 7.6 2.7 10.3 7.0 52.0 2 1 2
14 187.100 419.00 3.2 0.3 3.1 40.0 365.0 5 5 5
15 0.075 1.20 6.3 2.1 8.4 3.5 42.0 1 1 1
16 3.000 25.00 8.6 0.0 8.6 50.0 28.0 2 2 2
17 0.785 3.50 6.6 4.1 10.7 6.0 42.0 2 2 2
18 0.200 5.00 9.5 1.2 10.7 10.4 120.0 2 2 2
19 1.410 17.50 4.8 1.3 6.1 34.0 252.0 1 2 1
20 60.000 81.00 12.0 6.1 18.1 7.0 12.0 1 1 1
21 529.000 680.00 11.9 0.3 12.5 28.0 400.0 5 5 5
22 27.660 115.00 3.3 0.5 3.8 20.0 148.0 5 5 5
23 0.120 1.00 11.0 3.4 14.4 3.9 16.0 3 1 2
24 207.000 406.00 10.4 1.8 12.0 39.3 252.0 1 4 1
25 85.000 325.00 4.7 1.5 6.2 41.0 310.0 1 3 1
26 36.330 119.50 10.9 2.3 13.0 16.2 63.0 1 1 1
27 0.101 4.00 10.4 3.4 13.8 9.0 28.0 5 1 3
28 1.040 5.50 7.4 0.8 8.2 7.6 68.0 5 3 4
29 521.000 655.00 2.1 0.8 2.9 46.0 336.0 5 5 5
30 100.000 157.00 9.7 1.2 10.8 22.4 100.0 1 1 1
31 35.000 56.00 10.4 3.4 13.8 16.3 33.0 3 5 4
32 0.005 0.14 7.7 1.4 9.1 2.6 21.5 5 2 4
33 0.010 0.25 17.9 2.0 19.9 24.0 50.0 1 1 1
34 62.000 1320.00 6.1 1.9 8.0 100.0 267.0 1 1 1
35 0.122 3.00 8.2 2.4 10.6 14.0 30.0 2 1 1
36 1.350 8.10 8.4 2.8 11.2 2.6 45.0 3 1 3
37 0.023 0.40 11.9 1.3 13.2 3.2 19.0 4 1 3
38 0.048 0.33 10.8 2.0 12.8 2.0 30.0 4 1 3
39 1.700 6.30 13.8 5.6 19.4 5.0 12.0 2 1 1
40 3.500 10.80 14.3 3.1 17.4 6.5 120.0 2 1 1
41 250.000 490.00 4.7 1.0 6.2 23.6 440.0 5 5 5
42 0.480 15.50 15.2 1.8 17.0 12.0 140.0 2 2 2
43 10.000 115.00 10.0 0.9 10.9 20.2 170.0 4 4 4
44 1.620 11.40 11.9 1.8 13.7 13.0 17.0 2 1 2
45 192.000 180.00 6.5 1.9 8.4 27.0 115.0 4 4 4
46 2.500 12.10 7.5 0.9 8.4 18.0 31.0 5 5 5
47 4.288 39.20 12.0 0.5 12.5 13.7 63.0 2 2 2
48 0.280 1.90 10.6 2.6 13.2 4.7 21.0 3 1 3
49 4.235 50.40 7.4 2.4 9.8 9.8 52.0 1 1 1
50 6.800 179.00 8.4 1.2 9.6 29.0 164.0 2 3 2
51 0.750 12.30 5.7 0.9 6.6 7.0 225.0 2 2 2
52 3.600 21.00 4.9 0.5 5.4 6.0 225.0 3 2 3
53 14.830 98.20 3.3 0.3 2.6 17.0 150.0 5 5 5
54 55.500 175.00 3.2 0.6 3.8 20.0 151.0 5 5 5
55 1.400 12.50 11.0 0.5 11.0 12.7 90.0 2 2 2
56 0.060 1.00 8.1 2.2 10.3 3.5 120.0 3 1 2
57 0.900 2.60 11.0 2.3 13.3 4.5 60.0 2 1 2
58 2.000 12.30 4.9 0.5 5.4 7.5 200.0 3 1 3
59 0.104 2.50 13.2 2.6 15.8 2.3 46.0 3 2 2
60 4.190 58.00 9.7 0.6 10.3 24.0 210.0 4 3 4
61 3.500 3.90 12.8 6.6 19.4 3.0 14.0 2 1 1
62 4.050 17.00 12.0 1.0 12.8 13.0 38.0 3 1 1
3、其他的专业方法

1
2
3
4
5
6
7
8
9
10
> #其他的专业方法 索引
> # package desc
> #Hmisc 包含多种函数,支持简单插补、多重插补和典型变量插补
> #mvnmle 对多元正态分布数据中缺失值的最大似然估计
> #cat 对数线性模型中多元类别型变量的多重插补
> #arrayImpute、 arrayMissPattern、 SeqKnn 处理微阵列缺失数据的实用函数
> #longitudinalData 相关的函数列表,比如对时间序列缺失值进行插补的一系列函数
> #kmi 处理生存分析缺失值的Kaplan-Meier多重插补
> #mix 一般位置模型中混合类别型和连续型数据的多重插补
> #pan 多元面板数据或聚类数据的多重插补

主成分和因子分析

主成分分析

1、主成分个数

1
2
3
4
5
6
7
8
9
10
11
12
13
14
15
> ##主成分和因子分析
>
> #主成分分析
> #PCA的目标是用一组较少的不相关变量代替大量相关变量,同时尽可能保留初始变量的信
> #息,这些推导所得的变量称为主成分,它们是观测变量的线性组合。如第一成分
> # PC1 = a1X1 + a2X2 + ... + akXk
> #它是k个观测变量的加权组合,对初始变量集的方差解释性最大。第二主成分也是初始变量
> #的线性组合,对方差的解释性排第二,同时与第一主成分正交(不相关)。
> #后面每一个主成分都最大化它对方差的解释程度,同时与之前所有的主成分都正交。
> #你可以选取与变量数相同的主成分,但从实用的角度来看,我们都希望能用较少的主成分来近似全变量集。
> library(psych)
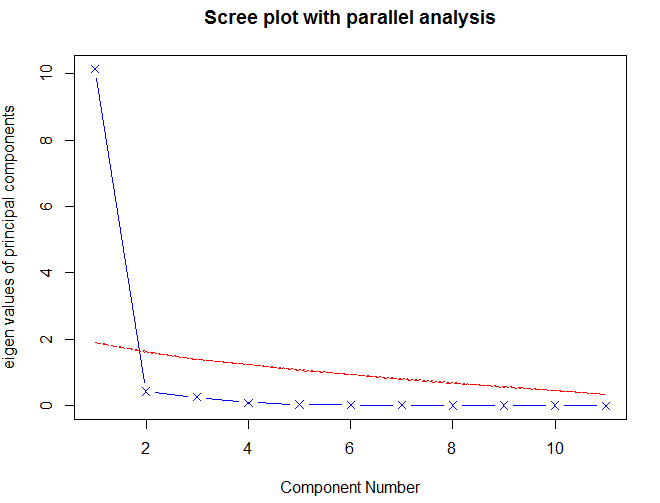
> fa.parallel(USJudgeRatings[,-1], fa="pc", n.iter=100, show.legend = FALSE, main="Scree plot with parallel analysis")
The estimated weights for the factor scores are probably incorrect. Try a different factor extraction method.
Parallel analysis suggests that the number of factors = NA and the number of components = 1
> #碎石图(直线与x符号)、特征值大于1准则(水平线)和100次模拟的平行分析(虚线)都表明保留一个主成分即可

2、提取主成分

1
2
3
4
5
6
7
8
9
10
11
12
13
14
15
16
17
18
19
20
21
22
23
24
25
26
27
28
29
30
31
32
33
34
35
36
37
38
39
40
41
42
43
44
45
46
47
> #提取主成分principal
> #factors设定主成分数(默认为1);
> #rotate指定旋转的方法[默认最大方差旋转(varimax)]。
> #scores设定是否需要计算主成分得分(默认不需要)。
> pc <- principal(USJudgeRatings[,-1], nfactors = 1)
> pc
Principal Components Analysis
Call: principal(r = USJudgeRatings[, -1], nfactors = 1)
Standardized loadings (pattern matrix) based upon correlation matrix
PC1 h2 u2 com
INTG 0.92 0.84 0.1565 1
DMNR 0.91 0.83 0.1663 1
DILG 0.97 0.94 0.0613 1
CFMG 0.96 0.93 0.0720 1
DECI 0.96 0.92 0.0763 1
PREP 0.98 0.97 0.0299 1
FAMI 0.98 0.95 0.0469 1
ORAL 1.00 0.99 0.0091 1
WRIT 0.99 0.98 0.0196 1
PHYS 0.89 0.80 0.2013 1
RTEN 0.99 0.97 0.0275 1
PC1
SS loadings 10.13
Proportion Var 0.92
Mean item complexity = 1
Test of the hypothesis that 1 component is sufficient.
The root mean square of the residuals (RMSR) is 0.04
with the empirical chi square 6.2 with prob < 1
Fit based upon off diagonal values = 1
> #PC1栏包含了成分载荷,指观测变量与主成分的相关系数,第一主成分(PC1)与每个变量都高度相关,也就是说,它是一个可用来进行一般性评价
> #的维度
> #h2栏指成分公因子方差——主成分对每个变量的方差解释度。 u2栏指成分唯一性——方差无法被主成分解释的比例(1-h2)。
> #例如,体能(PHYS) 80%的方差都可用第一主成分来解释,20%不能。相比而言, PHYS是用第一主成分表示性最差的变量。
>
> #SS loadings行包含了与主成分相关联的特征值,指的是与特定主成分相关联的标准化后的
> #方差值(本例中,第一主成分的值为10)。最后, Proportion Var行表示的是每个主成分对整
> #个数据集的解释程度。此处可以看到,第一主成分解释了11个变量92%的方差
>
> #多个主成分例子
> library(psych)
> fa.parallel(Harman23.cor$cov, n.obs = 302, fa="pc", n.iter=100,
+ show.legend = FALSE, main="Scree plot with parallel analysis")
Parallel analysis suggests that the number of factors = NA and the number of components = 2

1
2
3
4
5
6
7
8
9
10
11
12
13
14
15
16
17
18
19
20
21
22
23
24
25
26
27
28
29
30
31
32
33
34
> pc <- principal(Harman23.cor$cov, nfactors = 2, rotate="none")
> pc
Principal Components Analysis
Call: principal(r = Harman23.cor$cov, nfactors = 2, rotate = "none")
Standardized loadings (pattern matrix) based upon correlation matrix
PC1 PC2 h2 u2 com
height 0.86 -0.37 0.88 0.123 1.4
arm.span 0.84 -0.44 0.90 0.097 1.5
forearm 0.81 -0.46 0.87 0.128 1.6
lower.leg 0.84 -0.40 0.86 0.139 1.4
weight 0.76 0.52 0.85 0.150 1.8
bitro.diameter 0.67 0.53 0.74 0.261 1.9
chest.girth 0.62 0.58 0.72 0.283 2.0
chest.width 0.67 0.42 0.62 0.375 1.7
PC1 PC2
SS loadings 4.67 1.77
Proportion Var 0.58 0.22
Cumulative Var 0.58 0.81
Proportion Explained 0.73 0.27
Cumulative Proportion 0.73 1.00
Mean item complexity = 1.7
Test of the hypothesis that 2 components are sufficient.
The root mean square of the residuals (RMSR) is 0.05
Fit based upon off diagonal values = 0.99
> #第一主成分与每个身体测量指标都正相关,看起来似乎是
> #一个一般性的衡量因子;第二主成分与前四个变量(height、arm.span、forearm和lower.leg)
> #负相关,与后四个变量(weight、 bitro.diameter、 chest.girth和chest.width)正相关,
> #因此它看起来似乎是一个长度—容量因子。但理念上的东西都不容易构建,当提取了多个成分时,
> #对它们进行旋转可使结果更具解释性,接下来我们便讨论该问题。
>

3、主成分旋转

1
2
3
4
5
6
7
8
9
10
11
12
13
14
15
16
17
18
19
20
21
22
23
24
25
26
27
28
29
30
31
32
33
34
35
36
37
38
> #旋转
> #旋转是一系列将成分载荷阵变得更容易解释的数学方法,它们尽可能地对成分去噪。旋转方
> #法有两种:使选择的成分保持不相关(正交旋转),和让它们变得相关(斜交旋转)
> #最流行的正交旋转是方差极大旋转
> pc <- principal(Harman23.cor$cov, nfactors = 2, rotate="varimax")
> pc
Principal Components Analysis
Call: principal(r = Harman23.cor$cov, nfactors = 2, rotate = "varimax")
Standardized loadings (pattern matrix) based upon correlation matrix
RC1 RC2 h2 u2 com
height 0.90 0.25 0.88 0.123 1.2
arm.span 0.93 0.19 0.90 0.097 1.1
forearm 0.92 0.16 0.87 0.128 1.1
lower.leg 0.90 0.22 0.86 0.139 1.1
weight 0.26 0.88 0.85 0.150 1.2
bitro.diameter 0.19 0.84 0.74 0.261 1.1
chest.girth 0.11 0.84 0.72 0.283 1.0
chest.width 0.26 0.75 0.62 0.375 1.2
RC1 RC2
SS loadings 3.52 2.92
Proportion Var 0.44 0.37
Cumulative Var 0.44 0.81
Proportion Explained 0.55 0.45
Cumulative Proportion 0.55 1.00
Mean item complexity = 1.1
Test of the hypothesis that 2 components are sufficient.
The root mean square of the residuals (RMSR) is 0.05
Fit based upon off diagonal values = 0.99
> #列的名字都从PC变成了RC,以表示成分被旋转。观察RC1栏的载荷,你可以发现第一主成分
> #主要由前四个变量来解释(长度变量)。 RC2栏的载荷表示第二主成分主要由变量5到变量8来解
> #释(容量变量)
> #两个主成分旋转后的累积方差解释性没有变化(81%),变的只是各个主成分对
> #方差的解释度(成分1从58%变为44%,成分2从22%变为37%)。各成分的方差解释度趋同,准确
> #来说,此时应该称它们为成分而不是主成分(因为单个主成分方差最大化性质没有保留)。

4、获取主成分得分

1
2
3
4
5
6
7
8
9
10
11
12
13
14
15
16
17
18
19
20
21
22
23
24
25
26
27
28
> library(psych)
> pc <- principal(USJudgeRatings[,-1], nfactors = 1, scores = TRUE)
> head(pc$scores)
PC1
AARONSON,L.H. -0.19
ALEXANDER,J.M. 0.75
ARMENTANO,A.J. 0.07
BERDON,R.I. 1.14
BRACKEN,J.J. -2.16
BURNS,E.B. 0.77
>
> #当主成分分析基于相关系数矩阵时,原始数据便不可用了,也不可能获取每个观测的主成分
> #得分,但是你可以得到用来计算主成分得分的系数
>
> rc <- principal(Harman23.cor$cov, nfactors = 2, rotate="varimax")
> round(unclass(rc$weight), 2)
RC1 RC2
height 0.28 -0.05
arm.span 0.30 -0.08
forearm 0.30 -0.09
lower.leg 0.28 -0.06
weight -0.06 0.33
bitro.diameter -0.08 0.32
chest.girth -0.10 0.34
chest.width -0.04 0.27
>
> #则各记录的得分PC1 = 0.28*height +...-0.04 * chest.width
> #得分PC2 = -0.05*height +...+0.27 * chest.width

探索性因子分析

1、公因子数

1
2
3
4
5
6
7
8
9
10
11
12
13
14
15
16
17
18
19
20
21
22
23
24
25
26
27
28
29
30
31
32
> ##探索性因子分析
> #EFA的目标是通过发掘隐藏在数据下的一组较少的、更为基本的无法观测的变量,来解释一
> #组可观测变量的相关性。这些虚拟的、无法观测的变量称作因子。每个因子被认为可解释多个
> #观测变量间共有的方差,因此准确来说,它们应该称作公共因子。
> #112个人参与了六个测验,包括非语言的普通智力测验(general)、画图测验(picture)、积木图案测验(blocks)、迷津测验(maze)、
> #阅读测验(reading)和词汇测验(vocab)。我们如何用一组较少的、潜在的心理学因素来解
> #释参与者的测验得分呢?
> options(digits=2)
> covariances <- ability.cov$cov
> correlations <- cov2cor(covariances)
>
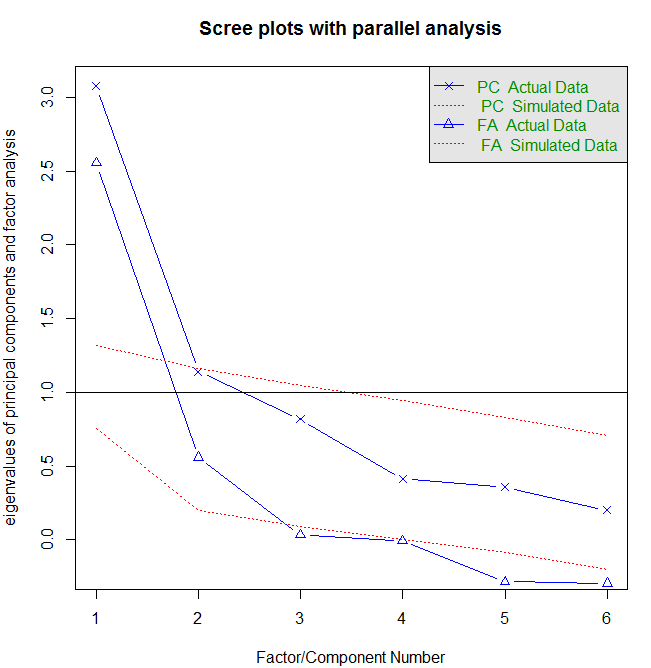
> fa.parallel(correlations, n.obs = 112, fa="both", n.iter=100, main="Scree plots with parallel analysis")
The estimated weights for the factor scores are probably incorrect. Try a different factor extraction method.
Parallel analysis suggests that the number of factors = 2 and the number of components = 1
There were 18 warnings (use warnings() to see them)
> #图中同时展示了PCA和EFA的结果。PCA结果建议提取一个或者两个成分, EFA建议提取两个因子
> #对于EFA, Kaiser-Harris准则的特征值数大于0,而不是1。
>

2、提取公共因子

1
2
3
4
5
6
7
8
9
10
11
12
13
14
15
16
17
18
19
20
21
22
23
24
25
26
27
28
29
30
31
32
33
34
35
36
37
38
39
40
41
42
43
44
45
46
47
48
49
50
51
52
53
> #提取公共因子
> # X1 = a1F1 + a2F2 + ... +anFn
> #fa(r, nfactors=, n.objs=, rotate=, scores=, fm=)
> #r是相关系数矩阵或者原始数据矩阵;
> # nfactors设定提取的因子数(默认为1);
> # n.obs是观测数(输入相关系数矩阵时需要填写);
> # rotate设定旋转的方法(默认互变异数最小法);
> # scores设定是否计算因子得分(默认不计算);
> # fm设定因子化方法(默认极小残差法)
>
> #提取公共因子的方法很多,包括最大似然法(ml)、主轴迭代法(pa)、加权
> #最小二乘法(wls)、广义加权最小二乘法(gls)和最小残差法(minres)
> #统计学家青睐使用最大似然法,因为它有良好的统计性质。不过有时候最大似然法不会收敛,此时使用主轴迭代法
> #效果会很好。
>
> fa <- fa(correlations, nfactors = 2, rotate = "none", fm="pa")
> fa
Factor Analysis using method = pa
Call: fa(r = correlations, nfactors = 2, rotate = "none", fm = "pa")
Standardized loadings (pattern matrix) based upon correlation matrix
PA1 PA2 h2 u2 com
general 0.75 0.07 0.57 0.432 1.0
picture 0.52 0.32 0.38 0.623 1.7
blocks 0.75 0.52 0.83 0.166 1.8
maze 0.39 0.22 0.20 0.798 1.6
reading 0.81 -0.51 0.91 0.089 1.7
vocab 0.73 -0.39 0.69 0.313 1.5
PA1 PA2
SS loadings 2.75 0.83
Proportion Var 0.46 0.14
Cumulative Var 0.46 0.60
Proportion Explained 0.77 0.23
Cumulative Proportion 0.77 1.00
Mean item complexity = 1.5
Test of the hypothesis that 2 factors are sufficient.
The degrees of freedom for the null model are 15 and the objective function was 2.5
The degrees of freedom for the model are 4 and the objective function was 0.07
The root mean square of the residuals (RMSR) is 0.03
The df corrected root mean square of the residuals is 0.06
Fit based upon off diagonal values = 0.99
Measures of factor score adequacy
PA1 PA2
Correlation of (regression) scores with factors 0.96 0.92
Multiple R square of scores with factors 0.93 0.84
Minimum correlation of possible factor scores 0.86 0.68
>
> #两个因子解释了六个心理学测验60%的方差。不过因子载荷阵的意义并不太好解
> #释,此时使用因子旋转将有助于因子的解释。

3、因子旋转

1
2
3
4
5
6
7
8
9
10
11
12
13
14
15
16
17
18
19
20
21
22
23
24
25
26
27
28
29
30
31
32
33
34
35
36
37
38
39
40
41
42
43
44
45
46
47
48
49
50
51
> #正交旋转
> fa.varimax <- fa(correlations, nfactors=2, rotate="varimax", fm="pa")
> fa.varimax
Factor Analysis using method = pa
Call: fa(r = correlations, nfactors = 2, rotate = "varimax", fm = "pa")
Standardized loadings (pattern matrix) based upon correlation matrix
PA1 PA2 h2 u2 com
general 0.49 0.57 0.57 0.432 2.0
picture 0.16 0.59 0.38 0.623 1.1
blocks 0.18 0.89 0.83 0.166 1.1
maze 0.13 0.43 0.20 0.798 1.2
reading 0.93 0.20 0.91 0.089 1.1
vocab 0.80 0.23 0.69 0.313 1.2
PA1 PA2
SS loadings 1.83 1.75
Proportion Var 0.30 0.29
Cumulative Var 0.30 0.60
Proportion Explained 0.51 0.49
Cumulative Proportion 0.51 1.00
Mean item complexity = 1.3
Test of the hypothesis that 2 factors are sufficient.
The degrees of freedom for the null model are 15 and the objective function was 2.5
The degrees of freedom for the model are 4 and the objective function was 0.07
The root mean square of the residuals (RMSR) is 0.03
The df corrected root mean square of the residuals is 0.06
Fit based upon off diagonal values = 0.99
Measures of factor score adequacy
PA1 PA2
Correlation of (regression) scores with factors 0.96 0.92
Multiple R square of scores with factors 0.91 0.85
Minimum correlation of possible factor scores 0.82 0.71
>
> #阅读和词汇在第一因子上载荷较大,画图、积木图案和迷宫
> #在第二因子上载荷较大,非语言的普通智力测量在两个因子上载荷较为平均,这表明存在一个语
> #言智力因子和一个非语言智力因子。
>
> #使用正交旋转将人为地强制两个因子不相关。如果想允许两个因子相关该怎么办呢?此时可
> #以使用斜交转轴法,比如promax
>
> library(GPArotation)
> fa.promax <- fa(correlations, nfactors=2, rotate="promax", fm="pa")
Warning message:
In fac(r = r, nfactors = nfactors, n.obs = n.obs, rotate = rotate, :
A loading greater than abs(1) was detected. Examine the loadings carefully.
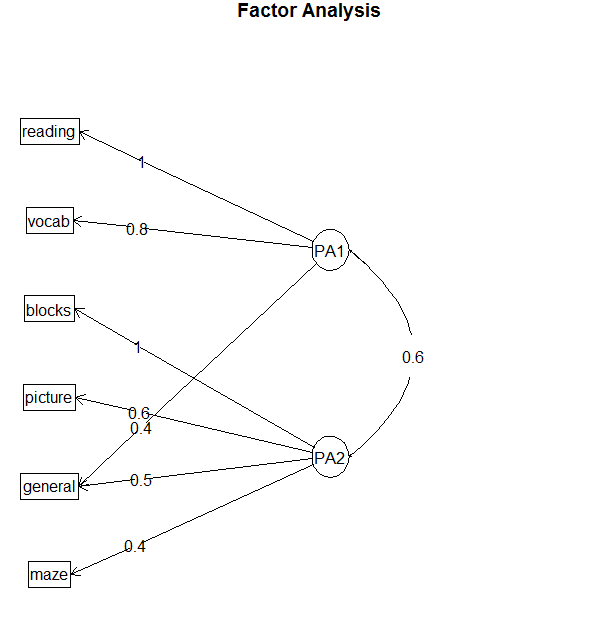
> #因子斜交的结果图形
> factor.plot(fa.promax, labels=rownames(fa.promax$loadings))


1
2
3
> #若使simple = TRUE,那么将仅显示每个因子下最大的载荷,以及因子
> #间的相关系数。这类图形在有多个因子时十分实用。
> fa.diagram(fa.promax, simple = FALSE)

4、因子得分

1
2
3
4
5
6
7
8
9
10
11
12
13
14
> #因子得分
> fa.promax <- fa(correlations, nfactors=2, rotate="promax", fm="pa", score=TRUE)
Warning message:
In fac(r = r, nfactors = nfactors, n.obs = n.obs, rotate = rotate, :
A loading greater than abs(1) was detected. Examine the loadings carefully.
> #获得用来计算因子得分的权重
> fa.promax$weights
PA1 PA2
general 0.078 0.211
picture 0.020 0.090
blocks 0.037 0.702
maze 0.027 0.035
reading 0.743 0.030
vocab 0.177 0.036